10 Database Bottlenecks We Hit Scaling to 5,000 Orders
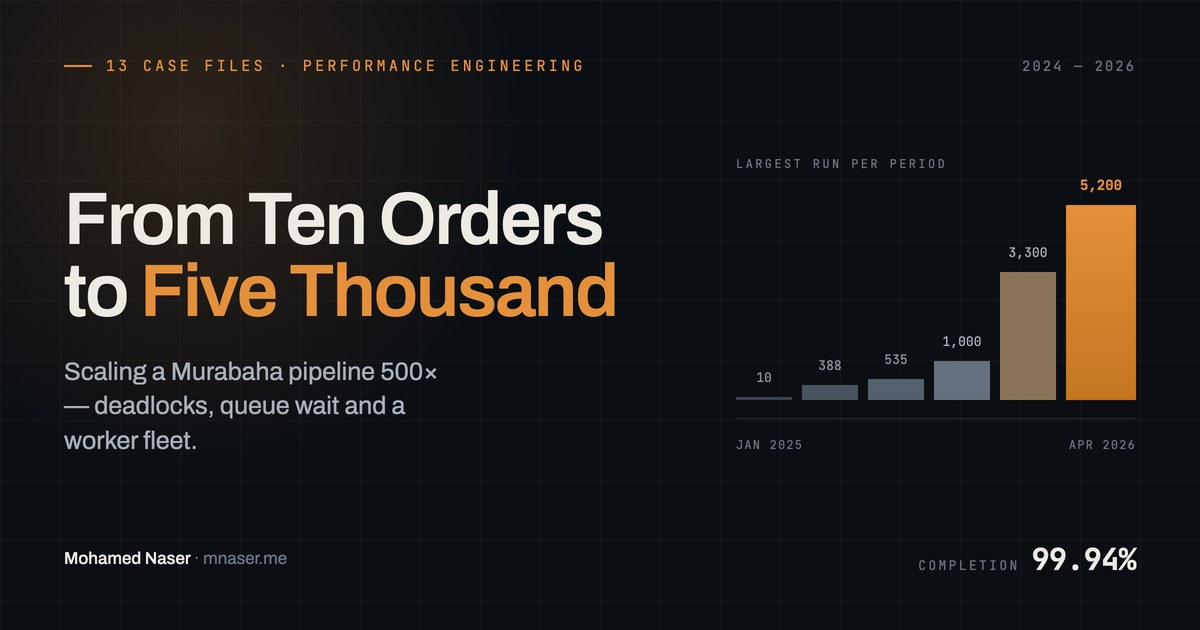
In January 2025 a stress test of ten automated orders left four of them stuck. Eighteen months later the same platform ran 5,200 orders end to end at 99.94%. Ten case files on the code and database work that got it there.
- database bottlenecks
- mysql lock contention
- read committed isolation
- database deadlocks
- database performance tuning
- missing index
- scaling laravel
- performance engineering
- stress testing
- fintech scaling
As Part 1 explains, a Murabaha order is not one transaction but a strict legal sequence — purchase real commodity units, transfer ownership to the borrower, sell to the open market, complete — none of which may be skipped, faked, or reordered. Each order fans out into a chain of queued jobs touching the hottest tables in the system: market orders, inventories, and millions of individually coded units. Making one such pipeline correct is ordinary engineering. Making five thousand of them run concurrently, with every legal constraint intact, is where the last two years of work went.
What follows are the ten battles that made the difference, in the order we fought them — the ones fought inside the code and the database. The infrastructure battles that came after, once the code had stopped being the constraint, are Part 3. We have kept the scars visible. Each case tells you what was actually going wrong, what we tried — including the ideas that did not survive contact with production — and what the numbers said when the dust settled.
Everything waits for everything
Aug 2024 – Jan 2025Impactceiling: tens → hundreds of orders
Our first real batch test, in December 2024, was humbling. We created 31 orders at once and watched three of them freeze for more than twenty minutes. When we retried with just ten orders, everything passed — and that, honestly, was the platform's ceiling at the time. A few weeks later a test run confirmed it the hard way: ten automated trade requests, four stuck in Purchasing Commodity.
Digging in, we found a platform designed for one order at a time, politely queuing the whole world behind it. Fifty simultaneous orders were processed strictly stage by stage — the first order could not buy its commodity until all forty-nine others had finished searching for theirs. Certificates rendered through a headless browser that fell over under load and took whole orders down with it. Stuck orders kept their commodity units reserved forever, so even cancelling them failed. And our very first "stuck orders" investigation ended somewhere nobody expected: the server disk was 98% full — 44 of 45 GB. Not a race condition, not a deadlock. A full disk.
We fixed the unglamorous things first: bigger disks. Then we gave the PDF service room to breathe — longer timeouts, more browser sessions, Chrome kept warm — which helped, though in hindsight we were treating a symptom we would only cure properly a year later (Case 04). The changes that mattered were structural. Work that ran synchronously inside requests moved into queued jobs. Jobs started carrying lightweight record IDs instead of whole serialized objects, because one stuck serialization had been pinning entire orders. And the single shared queue became three dedicated worker containers. Three. It felt like a fleet at the time.
The database fights back
Aug 2024 – Aug 2025ImpactP95 28s → 13s · slow tail 21.9% → 0
Then production started sending a new kind of message: Lock wait timeout exceeded.
Orders that should have flown were standing in line behind a single SELECT … FOR UPDATE,
like shoppers queuing at the one open till. Underneath it sat something subtler: the database's default
isolation level — REPEATABLE READ, safe and strict — quietly locks the gaps between
rows, and when many transactions touch neighbouring inventory rows, those gap locks collide into
deadlocks. We had the strange experience of adding capacity and watching throughput fall. More
concurrency meant more waiting.
It took three rounds to actually win. In the first, we treated each incident as it came: remove this
lock, log that deadlock (innodb_print_all_deadlocks on, so at least the next one would
leave a confession). Every individual fix worked — and the class of problem kept coming back with a new
address.
In the second round, April 2025, we went after the class itself and switched the platform to READ COMMITTED: giving up a strictness the Murabaha flow never actually needed, in exchange for dramatically less lock contention.
The third round came during the summer stress tests, when the sell path deadlocked anyway — the global setting was not reaching every transaction, so the hottest services got it explicitly. And the last deadlocks were removed the cheapest way of all: not by locking more, but by making every code path write to tables in the same order, so transactions could no longer meet head-on.
The purchase-path campaign
Jul – Sep 2025Impact1,000 orders, all within 14s
That summer we set ourselves a target — 500 orders without a single error — launched a 300-order run, and watched the first eleven orders die before doing anything at all. The culprit was a setting nobody had ever had a reason to think about: the framework's default 60-second job timeout. No job was ever supposed to run for a minute. The timeout was not the disease; it was the thermometer — and it was telling us the purchase path simply did too much, one thing after another, for every single order.
We raised the timeout to 120 seconds the same day — not as a fix, but as anesthesia, so testing could continue while we operated. Then came the actual surgery, a deliberate summer campaign. Buying commodities, creating trader orders, and holding units each got their own queue instead of sharing one line. The search for eligible commodities was separated from order initiation, so five workers could do in parallel what one had been doing alone. Inventory scans switched to cursors. We even dropped foreign keys from the busiest join table — heresy in most engineering conversations, but their integrity checks were pure cost on a table written millions of times a day, and the application already guaranteed those invariants itself. And the units table finally got its first serious indexes.
The certificate tax
Dec 2024 – Aug 2025Impact0 seconds per step
Every legal step of a Murabaha produces its evidence — a commodity certificate, an ownership certificate, a sell confirmation. For a long time nobody questioned where those documents were made: inside the step itself, by a headless Chrome browser that opened a full browser session for every single PDF and produced, at best, about 18 documents a minute. It was like closing the till to print each receipt on a printing press in the back room. Under load the press jammed, its queue backed up, and whole orders stood still — waiting not for money or commodities, but for paperwork.

First, we tuned the press. Longer timeouts, more concurrent sessions, Chrome kept warm and ready. It bought headroom for the next test — and changed nothing about the economics. Still one browser per document, still on the critical path.
Then we replaced the engine. A native PHP library went head-to-head against the browser and won convincingly: ~128 documents a minute against ~18 — seven times the throughput — with no external service, no per-document fees, documents staying on our own infrastructure, and proper Arabic right-to-left out of the box. Better in every way. And still seconds of rendering inside every step.
The winning move came from a different room. Sitting with the business and the Sharia requirements, we asked what the certificate actually had to be — and the answer was: it must exist and be obtainable, not be rendered before the step may complete. So the steps stopped generating PDFs entirely; a certificate renders the first time someone downloads it. And here is the quiet punchline: most certificates are never downloaded at all. Most of that work never needed speeding up. It needed to stop existing.
Which units can you even buy?
Dec 2024 – 2026Impactscan millions of rows → read a counter
Before a single unit can be purchased, the platform has to answer a question that sounds like a database query and is actually a small legal investigation: which of the millions of units is this particular customer allowed to buy, right now? A unit qualifies only if it is free, its supplier is active, and buying it would not violate the trade-rotation rules for that specific buyer — a unit you recently owned cannot rotate straight back to you.
In the early days we answered honestly and expensively: scan the units table, per order, with that customer's conditions. Millions of rows, thousands of concurrent orders, the same question over and over. For a long time, if you asked where the platform's time was going, a large part of the answer was: re-deriving an answer that had barely changed since the last time we derived it.
Generation one: compute the truth on demand. Correct, simple, and ruinously expensive — every order paid the full scan, and those scans were most of the read pressure behind the 94-million-read index in Case 09.
Generation two: the "settled" feature. When an order completes, mark its units as settled back to the market — in bulk, with a cheap flag — so eligibility queries can skip whole classes of units without inspecting them. The scans shrank. But the settlement chain groaned under its own weight (its jobs kept blowing past their time limits and eventually needed a full bulk rewrite), and the per-order scan was still there. Smaller, not gone.
Generation three: stop scanning altogether. If the question is always the same, keep the answer written down. A dedicated table now holds an eligible-quantity counter for every (customer, inventory) pair, and every event that changes the answer — a purchase, a settlement, a supplier switching on — updates the counter in that same moment, atomically. The schema itself refuses to let a counter go negative, and rebuild jobs can reconstruct any counter from the ground truth whenever we have a reason to doubt it.
The exact-change problem
Jan 2025 – 2026Impactgateway timeouts → milliseconds
Knowing which units are eligible still leaves the genuinely hard part. A Murabaha for, say, SAR 1,000,000 must be covered exactly by whole units with fixed prices — like paying an exact amount using only the banknotes in your wallet, when the wallet holds thousands of notes in dozens of denominations. Mathematicians know this family of puzzles as "exact change" problems, and they are famous for one thing: naive solutions explode. Ours did. On inputs of a few hundred inventories, the first implementation searched until the gateway itself hung up on it — and a slow search does not fail one order, it stalls the purchase step of every order queued behind it.
The version that survived thinks like a very fast cashier. It counts in whole halalas, never fractions — floating-point money that drifts by 0.01 is the difference between exact change and no change at all. Before searching, it checks whether an answer can even exist: if the most valuable 10,000 units on the table cannot reach the amount, the order fails instantly with a clear message instead of hunting for a solution that is not there.
Then it gets greedy: one linear pass through the eligible inventories, taking as many units of each as still fit in the remaining amount. For the vast majority of orders, that single pass lands exactly on zero. When a gap survives, it backtracks — puts a note back, swaps in different ones — and writes down every gap it fails to close, so even a failure comes out as a diagnosis: the market lacks units at these prices.
And it is kept on a deliberate leash: at most 10,000 units per trade, at most three seconds of thinking. One order failing fast with a useful message beats five thousand orders waiting behind a search that refuses to give up.
The platform attacking itself
Oct 2025Impactdatabase load −85%
One October morning the monitoring dashboard reported 228,291 database queries in a few hours — on a system doing almost nothing. We went looking for the traffic and found ourselves. A scheduler ran every minute and, with no duplicate check, had dispatched the same background job 22,400 times. A single unindexed history lookup had run 114,000 times. The first alarm had been, embarrassingly, the monitoring bill: millions of recorded events per day, all of them faithfully documenting our own waste.

The fixes read like an apology to the database. One composite index turned the hot lookup from a scan into a seek. A cached "last action" column meant roughly 90% of those history queries no longer needed to run at all. And the scheduler grew up: it loads work in batches, skips anything it touched in the last five minutes, checks what is already queued before dispatching again, and staggers its dispatches with a small random delay — so a thousand jobs stop arriving in the very same second.
The regression the baseline caught
Nov 2025Impact2s per order recovered in a week
In November, the weekly numbers twitched. The purchase step, steady around seven seconds for weeks, came in at nine — then nearly ten. Nothing had failed: every order completed, no alarms fired, nobody complained. Which is exactly what makes this kind of bug dangerous. Without a baseline, two extra seconds on every order quietly becomes the new normal, and nobody ever asks why.
The percentile history let us bisect by deployment, and the answer was uncomfortable: the slowdown came from a bug-fix. A certificate had been naming the wrong previous owner; the correction was right, but it did its checking in the middle of every single purchase. We reverted it in production the same week — protecting the step while the fix stayed alive in testing — and then rebuilt the same correction so it did its work off the critical path.
The coded-unit ledger battles
2024 – 2026Impact3,300 orders · 100% · ledger intact
As Part 1 explains, stock lives as individually coded units, each tracked to its owner, with every ownership change appended to a legal ledger by a database trigger. That units table is the hottest object in the platform — one of its indexes alone had served 94 million reads when we first profiled it — and it answers to three masters at once: no two orders may ever hold the same unit, the ledger may never miss a row, and finding eligible units among millions has to stay fast. Almost every scaling battle we fought eventually landed on this table.
Exclusive holds took years of iteration: counters that tolerate crashes without drifting, a repair job for corrupted holds, overlap middleware on the jobs that could collide — and one queue deliberately left at a single worker, because for that step, correctness genuinely could not be parallelized. Knowing when not to scale is also scaling.
The table's indexes have a history like a battlefield map: added, removed, rebuilt as virtual-column composites, extended, pruned again. Every index makes the reads faster and the millions of ownership writes slower, so each one had to earn its keep with measurements — index hygiene became a recurring chore, not a one-time setup.
One experiment deserves its own confession. We added model-level caching to the hot tables to save reads — and months later reverted it for the write-heavy ones, because under real load the caching cost more than it saved. It stung. It is also exactly why we measure.
And the trigger met its match at settlement scale. The per-row trigger guarantees no ledger row is ever missed — and it became the slowest part of bulk settlement. We did not remove the guarantee; we changed who writes. The settlement rewrite produces the very same ledger rows through set-based bulk statements, thousands at a time, with the trigger stepped around only for that audited path.
When the jobs themselves fail
2024 – 2026Impactfailed job ≠ failed transaction
Everything in this platform is a job — every step transition, every certificate, every settlement. That is what makes 5,000 concurrent orders possible, and it carries a sober corollary: whatever happens to a job happens to a customer's transaction.
In the early platform, a job's life could end three ways, and all of them were bad. A failed job simply died — there was no retry, so a database hiccup lasting one second froze a customer's Murabaha until an engineer went in by hand. Nothing stopped two workers on two different servers from grabbing the same work — and in a system that moves money and transfers ownership, doing something twice is as dangerous as not doing it at all. And when we first added locks to prevent that, the locks never expired: a worker killed mid-job left its lock behind forever, blocking the order with a "max attempts exceeded" error whose cause you could never find — because the cause was a ghost.
The platform we run now starts from a different assumption: every job will eventually die mid-flight — the work is making that boring. Jobs retry on their own, waiting 1, 2, 3, 5, then 30 seconds between attempts: patient enough for a transient fault to clear, quick enough that the order barely notices. If we had to name the single most important mechanism behind zero failed transactions, it is this one — most failures are temporary, and a platform that retries well simply does not lose them.
Critical jobs are declared unique per order across the whole fleet, so a duplicate dispatch from any server is refused at the queue itself, not caught after the damage. The locks learned to die: they expire shortly after the worker timeout, so a crashed worker's lock heals on its own, and an overlapping dispatch politely re-queues after a short delay instead of burning through its retries on the spot. Even deploys stopped being a hazard — a worker being shut down now finishes or hands back its job instead of taking it to the grave.
The scaling ladder
2024 – 2026| Date | Test scale | Outcome |
|---|---|---|
| Dec 2024 | 31 orders | 3 stuck >20 min; 10-order retest passed — root cause: disk 98% full |
| Jan 2025 | 10 orders | 4 of 10 stuck in Purchasing Commodity |
| May 2025 | 388 orders / hr | Handful stuck at initiation and ownership |
| Jun 2025 | 535 orders | 534 completed — first full auto-sell cycle |
| Aug 2025 | 1,000 orders | Post-fix: P95 13s, zero orders over 15s |
| Feb 2026 | 2,500 × 5 runs | 99.92–100% success, ~48–50 min per run |
| Mar 2026 | 3,300 orders | 100% completed |
| Apr 2026 | 5,200 orders | 99.94% — 3 stuck, end-to-end |
| Jun 2026 → | 5,000 orders | Routine daily performance test; create-order API ~1.2s avg |
Business logic as a performance lever
ThroughoutThreaded through the cases above are wins that were not technical at all — product decisions about what the Murabaha flow actually requires:
- Auto Complete Sell. Allowing companies to opt into automatic contract, wakala, and sell steps is what made unattended 5,000-order runs possible at all — and mirrors how high-volume lenders want to operate.
- Certificates on demand. Sharia-required documents are still produced — but at download time, off the order's critical path (Case 04).
- Trade rotation count. A controlled pre-production A/B (five 2,500-order runs before and after) proved that reducing commodity trade rotations from 2 to 1 carried no performance penalty, clearing the way for the Specialized Entity flow on business merits alone.
- Force Forward. At scale, some tiny fraction of orders will always strand. Rather than database surgery by engineers, admins got an audited per-step "force forward" action, with automatic order expiry as the second safety net.
- A standing performance program. Weekly (now daily) pre-production stress tests with recorded percentiles, quarterly performance epics, and dedicated worst-case scenarios — performance became a product feature with an owner, not an emergency.
Ten orders once broke this platform. By the end of these ten cases, five thousand ran end to end at 99.94% — and the last of them had already changed the shape of the problem. With the code no longer the constraint, the waiting had moved somewhere else entirely: into the space between the jobs, and into a worker fleet nobody had designed on purpose. That is Part 3.