Scaling Queue Workers: From 3 Containers to 122 Processes
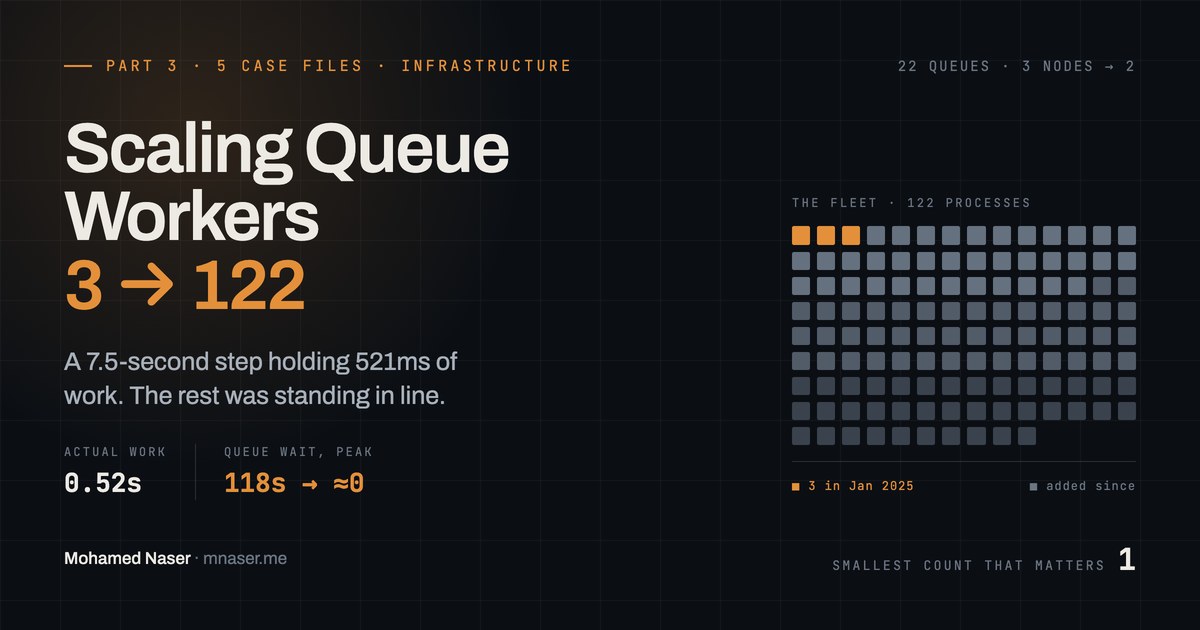
A purchase step that took seven and a half seconds contained 521 milliseconds of actual work. The rest was queue wait. Five case files on the infrastructure half of the story: splitting queues, sizing a worker fleet, and the deploys that quietly skipped it.
- scaling queue workers
- queue worker fleet
- queue wait time
- docker compose scale
- laravel queue
- redis queue
- worker autoscaling
- graceful shutdown
- rolling deploy
- infrastructure consolidation
Part 2 · 10 Database Bottlenecks We Hit Scaling to 5,000 Orders — the ten battles fought in the code and the database, from 4-of-10 stuck to 99.94% of 5,200 orders.
Part 2 ends where the code stops being the problem. Every case in it was a fix you could point at in a diff: an isolation level, a missing index, a transaction boundary, a rendering engine. What follows are the five battles that came after — the ones fought in the space between the jobs rather than inside them, where the code is innocent and the topology is the product.
The cases stay numbered continuously with Part 2, because they happened in the same two years and often in the same week. As before, each one tells you what was actually going wrong, what we tried — including the attempts that had to be reverted — and what the numbers said afterwards.
The seven seconds between the jobs
May – Aug 2026Impactwait ~118s → ≈0 · 5,000 daily
By mid-2026, 5,000-order runs were routine — and the daily test showed the Borrower Ownership step taking around two minutes for 4,000 of the 5,000 orders. The decisive clue came from an exercise anyone can copy: we added up the actual CPU time of every job in the purchase step and got 521 milliseconds — inside a step that observably took seven and a half seconds. The code was innocent. The other seven seconds were spent standing in line. And queue wait has a cruel personality: invisible when the system is idle (~0s), noticeable under load (~7s at 91 orders a minute), catastrophic at peak (~118 seconds).

The fix was to stop making unrelated work share one line. Ownership transfers and auto-sales had been competing for the same eight workers; each got its own dedicated queue on its own server, and the two-minute wait evaporated.
Then the fix backfired — upstream. With that backpressure gone, the purchase step nearly tripled, from 3.6 to 9.9 seconds. All the throughput we had just freed slammed into a 700,000-row table that had no index on the one column every duplicate-check searched — a full table scan that had been hiding behind the queue the entire time. One index later, the job was back under a second.
The rest was housekeeping that only matters at this scale: fifteen log lines per order deleted (about 100 MB of logs a day at 5,000 orders), unused indexes dropped to cut write cost, and explicit connection budgets after the full worker fleet exhausted the database's connections.
Running a fleet, not a server
2025 – 2026Impact3 containers → 122 workers · 3 nodes → 2
Splitting queues, as Case 11 shows, is how you stop unrelated work from queuing behind itself. But every split leaves you with something new to run — and by 2026 the platform was no longer "an application on a server." It was 22 queues, one worker service each, and 122 worker processes spread across three machines, plus a scheduler. Every one of those processes is a small daemon holding database connections, consuming memory, and fully capable of ruining the others' day. And 122 is only the resting number: a rolling deploy brings the new generation up alongside the old one, so for a few minutes on every release the fleet is 244.
Nobody designs that on day one. It accumulates, and it accumulates asymmetrically: a queue that was busy in March is idle in July, a queue nobody predicted becomes the bottleneck overnight, and the machines you sized identically turn out to be doing wildly different amounts of work. At one point one server was running 63 worker processes while another ran 22. Left unmanaged, a worker fleet develops exactly the problems a city does — congestion in one district, empty streets in another, and infrastructure nobody remembers approving.
Every number in the fleet is a decision
| Change | Why it changed | What it did |
|---|---|---|
| Dedicated queues for ownership and auto-sell Jul 2026 | The two highest-volume job types were blocking each other on eight shared workers. | 4 replicas each, on two machines. The ~118-second wait went to ~0 (Case 11). |
trader_order_initiation 5 → 10Jul 2026 | Removing the downstream backpressure exposed this queue as the next constraint — jobs waiting, not working. | 10 at rest, 20 mid-deploy. |
| Unit-creation queue 5 → 8 Jul 2026 | It became the new tail of the purchase step once everything upstream got faster. | 8 per machine at rest, 16 mid-deploy. |
| Rebalance four queues across machines Jul 2026 | One server carried 63 worker processes while another carried 22. | 35 / 40 / 36. No queue's total concurrency changed — only which machine ran it. |
| Delete two dead workers Jul 2026 | No producer anywhere in the codebase. Five replicas were polling a queue nothing ever wrote to. | Five processes reclaimed — and ten orphaned containers discovered still running. |
Rename …units_logging → …units_creationJul 2026 | The name said logging; the worker created inventory units. Nobody could reason about the fleet from its own names. | Old queue drained to zero before the cutover, so no job was stranded under the dead name. |
| Two new certificate queues Aug 2026 | Bid-certificate and order-result jobs were sharing one general-purpose queue with everything else in that integration. | 5 replicas each on two machines — the change that takes the fleet from 122 to 142. |
| Order initiation pinned at 1 standing rule | Parallelism at this step is not safe: concurrent workers race each other. | Never scaled, in any environment, deliberately. |
The fleet is a file, not folklore. Every queue's worker count, per machine, is declared in the deployment script — so the entire topology arrives in a pull request instead of being discovered by SSH-ing into a box, and when a number changes the reason is in the commit. The catch is that a queue lives in four places: the Compose profile list, the steady-state scale block, the rolling-deploy scale block, and the service list the deploy iterates over. Miss one and the queue is deployed but not scaled, or scaled but never restarted onto the new image.
"Groups" are machines. The three Compose profiles map one-to-one onto physical servers in pre-production and production; the deploy runs all three in parallel, one per node. In development and sandbox the same file collapses onto a single box at one replica per queue. One description, three shapes — which is the only reason a fleet this size stays reviewable.
We add where the measurement points, not where the anxiety is. Every row in the table above began as a timing measurement showing a queue whose jobs were demonstrably waiting rather than working. None of them began as "this feels slow."
And we remove just as deliberately. Dead workers get deleted, misleading names get corrected, and a queue is drained to zero before it is renamed — because renaming a queue while jobs are still sitting in it is how you lose transactions. One queue is pinned at a single worker forever: the step where parallelism cannot be made safe. In a case study full of scaling-up decisions, the most important number in the fleet is a one.
A duplicate flag silently halves a queue. Compose keeps only the last value when the same service is scaled twice, so merging two profile groups onto one host quietly drops one queue from 8 workers to 4 and another from 5 to 2. No error, no warning — just a slower system and a load-test result that means nothing.
One undefined YAML anchor blocks every deploy. A Compose file referenced a
*graceful-stop anchor that had never been defined on that branch. docker compose
config failed — and since every deploy command parses the file first, all of them broke
at once.
Deleting a service does not stop its containers. Removing a worker from the file leaves the running containers behind unless the deploy is explicitly told to remove orphans — and even then, containers whose profile is no longer active survive the sweep. Five of them came back after a routine reboot, restarted by their own restart policy, quietly serving a three-week-old image.
The real ceiling is connections, not CPU. In June 2026 a smaller environment was running all three groups at production replicas on one server: 86 worker containers against a database connection limit of 151, with an unbounded pool of web processes competing for what was left. The fix was a budget rather than a bigger database — web processes capped at 10 and recycled every 500 requests, small environments pinned to one replica per queue, which brought the whole environment to about 28 connections instead of 86.
Retiring a machine can retire the scheduler. The scheduler's profile was attached to the third server group, so decommissioning that group would have stopped every cron job on the platform without stopping anything anyone was watching. Caught while planning the consolidation; the trigger moved with it.
The workers were running last month's code
Jun 2026Impactstale image → every worker on the build
Jobs were finishing and their follow-up jobs were not starting. The chain simply stopped — no exception, no failed job, nothing in the logs to attach blame to. The follow-up jobs existed; they were sitting in a database table that nothing was reading.
The workers were running an image from an earlier deploy, and baked into that image was an old environment file naming the database queue driver — from before the platform moved to Redis. The application dispatched to Redis. The workers, still on the old build, wrote and read the database table. Every follow-up job in every chain landed in a queue nobody was watching.
Deploys had been reporting success the whole time. The web container picked up new code on every release; the workers had not picked up any.
Two separate things had to be true before a worker could ever receive a build. The first was that
Compose cannot detect that the contents behind a fixed tag have changed — every service referenced
:latest, so docker compose up saw no reason to replace a container that was
already running. Making the build's commit hash the image tag turns "new code" into something the tool
can actually see.
That alone did not fix it. The rolling deploy scaled workers up with --no-recreate,
which suppresses image swaps outright, and only the web container had an explicit force-recreate — so
the scale up-and-down never replaced a single worker. Workers got their own force-recreate, scoped to
the worker profiles and with --no-deps, because an earlier unscoped attempt had
force-recreated the databases along with everything else and had to be reverted.
The same audit turned up a tax nobody had costed. Every worker was taking its full ten-second stop
grace and then being killed outright on each deploy — the bulk of a roughly 140-second scale-down. The
pcntl extension had never been installed, so the queue worker could not trap stop signals
at all, and the stop signal inherited from the base image was not one it would have handled anyway.
Installing the extension and sending the signal the worker actually listens for dropped idle shutdown
from about ten seconds to about one.
The boring failures
ThroughoutImpactsurprises moved out of production
Not every scale failure is clever. The stress-test program kept tripping over limits nobody had ever
written down: a test server's disk at 98% (December 2024), and stress-test environments filling their
disks with logs again in March 2026. A smallint column that overflowed when test data
pushed past 32,000 registered companies — the database equivalent of an odometer
rolling over. The default 60-second job timeout. The day the full worker fleet exhausted the database's
connections. Deploys that killed whatever jobs were running.

Each one got the boring fix it deserved: standardized log rotation, wider column types, explicit connection budgets per environment (smaller environments hold ~28 database connections instead of ~86 at full scale), graceful worker shutdown. But the real fix is the habit around them: the stress tests run daily precisely so that the next limit nobody wrote down fails in a test, in pre-production, at dawn — instead of in production, at noon, with customers watching.
Two machines instead of three
Aug 2026Impact3 nodes → 2 · concurrency unchanged
By August 2026 the case for three application servers in pre-production was mostly historical. Sizing them down was the easy part. The surprise was finding out what they had been doing.
One node was serving 100% of the HTTP traffic. The second node's access log had been empty since February. The third received nothing but 404s. "Three web nodes" was a fiction: two of them had been worker-only for six months and nobody had noticed, because the workers kept working and the site kept answering.
The cause was a few lines of web-server config. The load balancer's health check is a bare request
for / with no host header, so it lands on whichever virtual host the server treats as its
default. Only one node had a catch-all default vhost — serving a static welcome page — so only that node
answered 200. On the others the API's own hostname became the implicit default and returned 404 to a
probe that had never asked for it. Permanently unhealthy, permanently out of rotation.
Worth noting what that probe does not do: the page it hits is static. It never touches the application. A completely dead app tier would have gone on reporting itself healthy.
The consolidation was a redistribution, not a reduction. The retiring node's queues were reassigned across the two survivors with every queue's total concurrency held identical — the same 122 worker processes, split 66 and 56, weighted so the node that also serves HTTP carries fewer.
Three things nearly went wrong and were caught in review rather than in production. The scheduler's profile was attached to the group being retired, so decommissioning it would have silently stopped every scheduled job on the platform; the trigger moved first. Merging two profile groups onto one host would have passed a scale flag twice for the same service — and Compose keeps the last value, quietly halving two queues (Case 12). And memory had to be sized by the rolling-deploy peak rather than the resting fleet: workers idle at about 82 MiB each, but every replica doubles mid-deploy, which put the peak near 11 GiB on 8 GB boxes. Both nodes were resized to 16 GB before anything moved.
Two nodes now run the same 122 worker processes at the concurrency three used to, on an identical image, with every queue depth at zero — and the node that had been invisible to the load balancer since February is back in rotation serving traffic.
One honest caveat, since this series keeps the scars visible: the worker split is still the asymmetric 66/56 that was drawn on the assumption that the second node had no web tier, and the three-node baseline it will be compared against had one node absorbing all the traffic. Any timing comparison across that boundary conflates two changes at once. The next run is the one that will mean something.
What two years taught us
- Sum your job times before optimizing your job code. 0.52s of work inside a 7.5s step means the code is innocent; the queue topology is the product (Case 11).
- Every fix moves the bottleneck. Removing backpressure downstream will expose the next unindexed query upstream. Budget for the second-order effect before celebrating the first (Case 11).
- Every job will eventually die mid-flight. Retries with escalating backoff, per-order uniqueness, and self-expiring locks turned "failed job" from a stuck transaction into a non-event — retrying well is how you reach zero failed transactions (Part 2, Case 10).
- Measurement must precede tuning. Per-step durations, weekly percentiles, and timing logs turned arguments into diffs. Our worst regression was caught in one week because a baseline existed (Part 2, Case 08).
- The best optimization is not doing the work. Two engineering attempts made PDF generation faster; one business conversation made most of it unnecessary (Part 2, Case 04).
- A worker fleet needs an owner. Twenty-two queues and 122 worker processes only stay sane if every count is justified in code review and removed as deliberately as it was added (Case 12).
- A deploy that only verifies the web tier is not a deploy. Workers ran a stale image — and a stale environment inside it — for weeks while every release reported success (Case 13).
- Health checks lie by default. A probe that never touches your application will call a dead application healthy, and a node that has been out of rotation for six months looks exactly like a node doing its job (Case 15).
- Scale failures are usually boring. Full disks (twice), a smallint overflow, a default 60-second timeout, and log volume did as much damage as any deadlock (Case 14).
- Isolation levels and locks are product decisions in disguise. READ COMMITTED, dropped foreign keys, trigger bypasses, and a deliberately single-threaded queue were all conscious trades of theoretical strictness for real-world correctness under load (Part 2, Cases 02 and 09).
- Keep the failed experiments on the record. The caching that hurt, the fix that regressed, the timeout raise that only bought time — the retries are where the understanding came from.
- The last 0.1% needs an operational answer, not a code one. At 5,000 orders, 99.9% success still strands five orders. Force-forward tooling and auto-expiry close the loop (Case 14).
Ten orders once broke the platform. Today, five thousand are a daily routine — and the same discipline that got us here (measure, split, index, budget, re-measure) is already pointed at the next order of magnitude.